Master the chart, master the pool: technical analysis for Meteora LPs.
How I use technical analysis to place DLMM ranges: support zones, retests, RSI divergence, and chart patterns that keep an LP profitable.
Disclaimer: If you are a profitable LP, you LP for longer, you have a strategy that works, and you love to dig into on-chain data, this post might not be for you. And as always NFA and SAFU.
In my recent 1-on-1 coaching sessions, I've noticed a pattern: people either think LPing is a set-and-forget task or don't know much about technical analysis. Then they wonder why price changes are ruining them. Knowing how pools, bins and bin steps, and fees work is not enough.
If you want to survive and really stack $SOL on @MeteoraAG, you need to use the chart as a map. This is how I use Technical Analysis to play the probability game and stay profitable.
The game of probabilities
First, let's be honest. TA is not a magic ball. It's a probability game. If someone tells you they always win, they are trying to sell you something. I don't want to be right all the time. I want to use past price action to figure out where the market is "probably" going next. If I can be right 60 to 70% of the time and have a plan for when I'm wrong, I win.
When you LP, you are like a market maker. You're just throwing money into a void if you don't know where the support is.
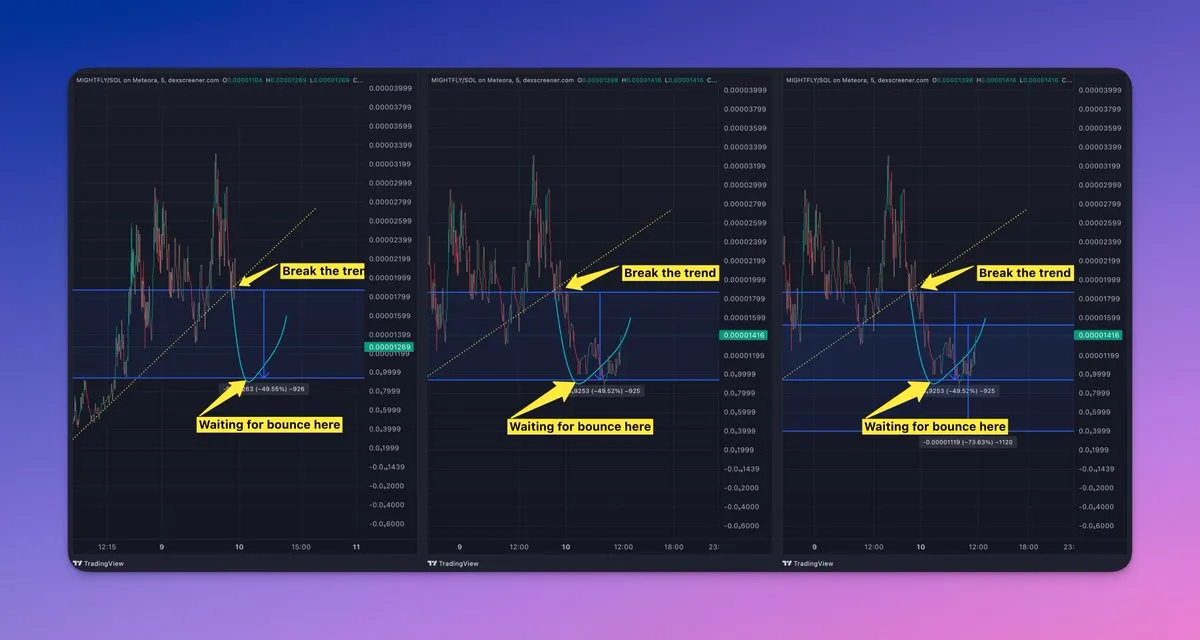
One of the latest examples:
 MichaelZogot@MichaelZogot
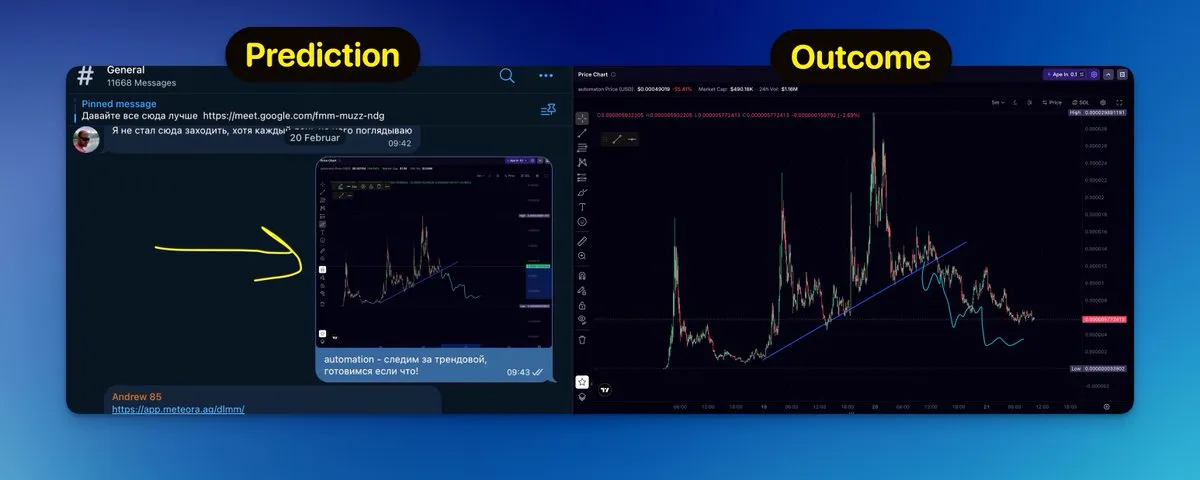 Feb 21, 2026View on X ↗
My LP toolkit
When I look at a chart for a possible DLMM job, there are a few things I look for that tell me it's time to act.
1. Breakouts and trend analysis
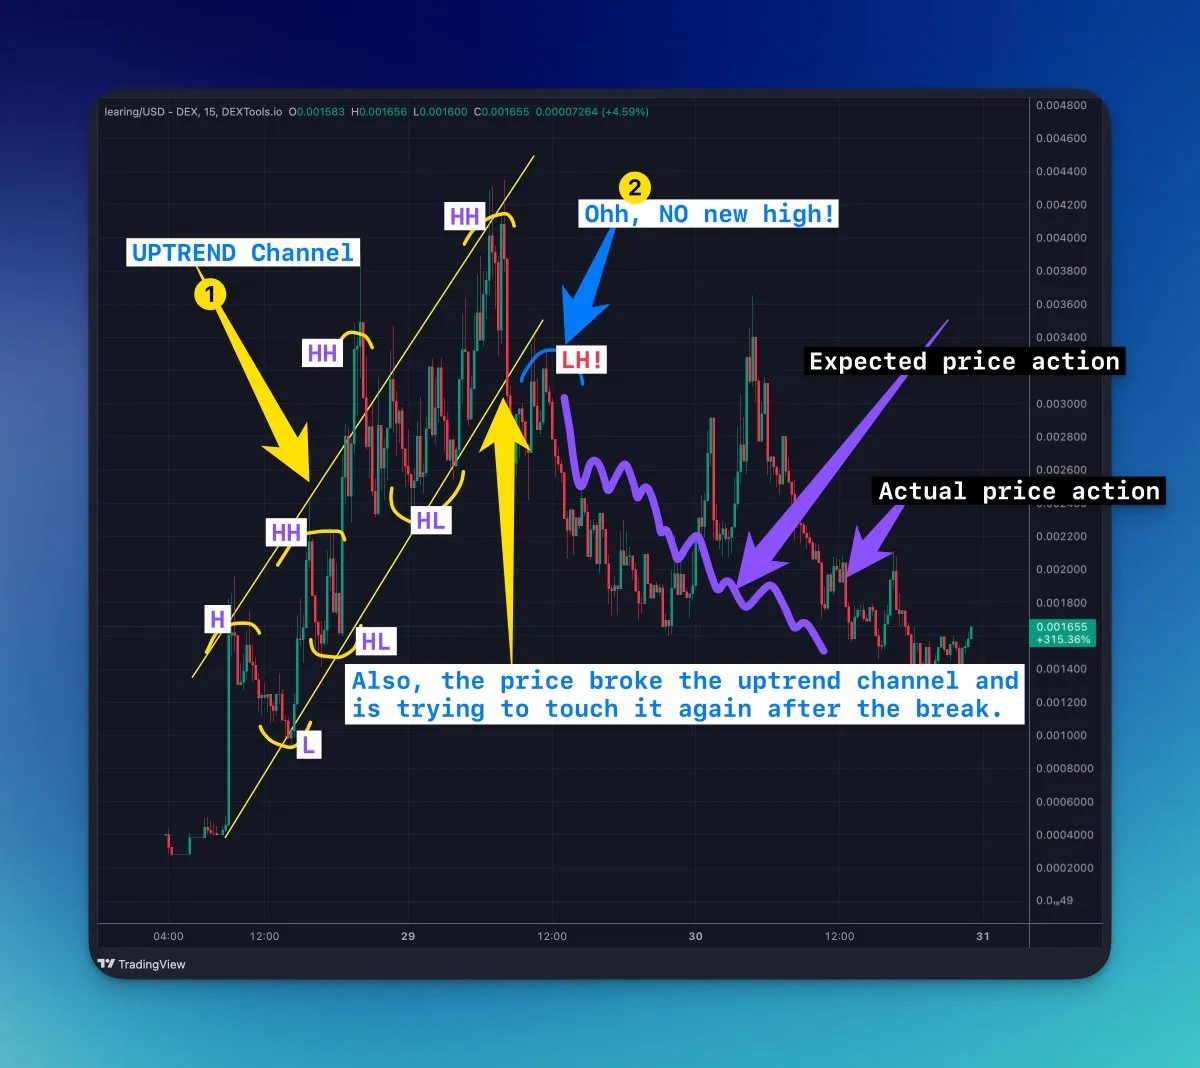
On higher timeframes (1 hour or more), I'm looking for a clear uptrend. I want to see a strong structure, not a line that is about to break. A breakout from a consolidation zone tells me that volume is coming back. I don't just jump in at the top when I see a breakout. I wait for the move to take a breath.
2. The strength of the retest
This is where most new traders lose money. They FOMO into a rise. I wait for the retest. The retest is just proof that the initial move will continue. If the retest comes after a fall, then the fall will continue. If it comes after an up move, then it will continue to rise.
3. Resistance and support
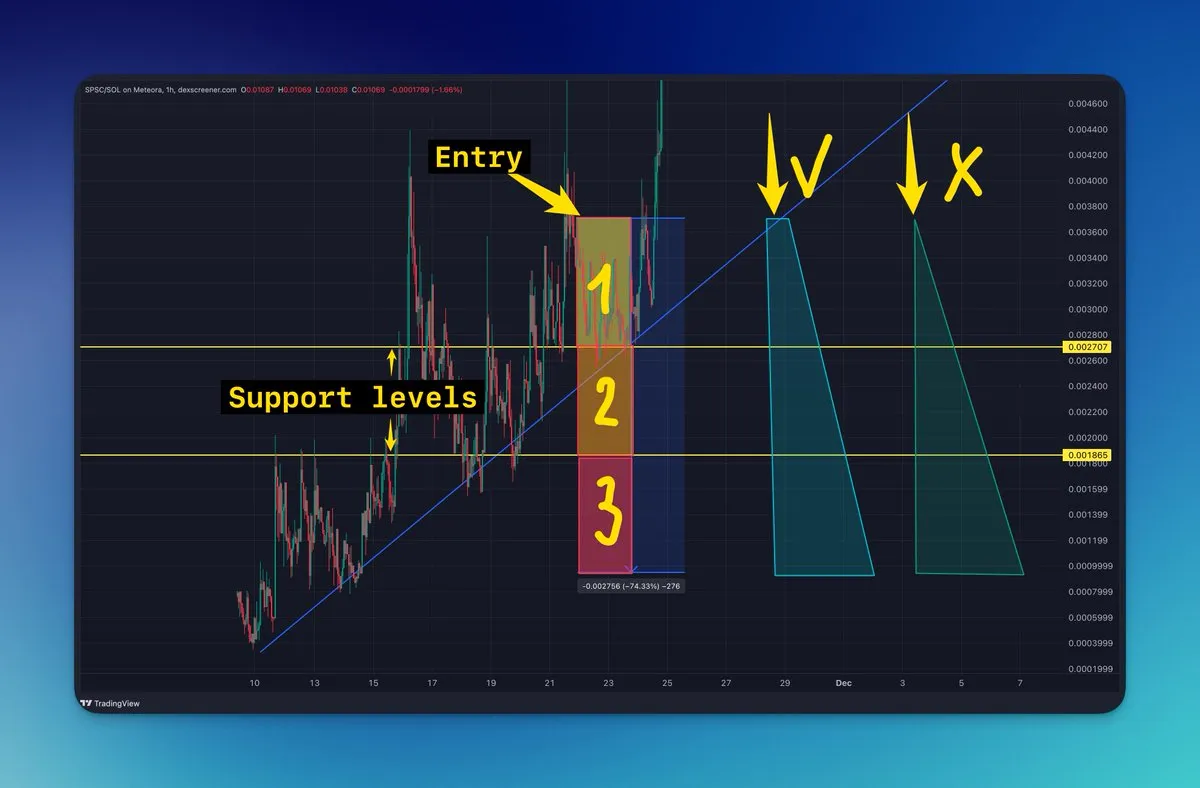
I look for "zones" instead of just one price point. These are the places where I will put my bins. I put my one-sided SOL liquidity in a strong support zone below the current price. It makes me feel better that if the price goes down, it will bounce back in my range, making me money and lowering my risk of being stuck with a bag of tokens I don't want.
4. Divergence in RSI
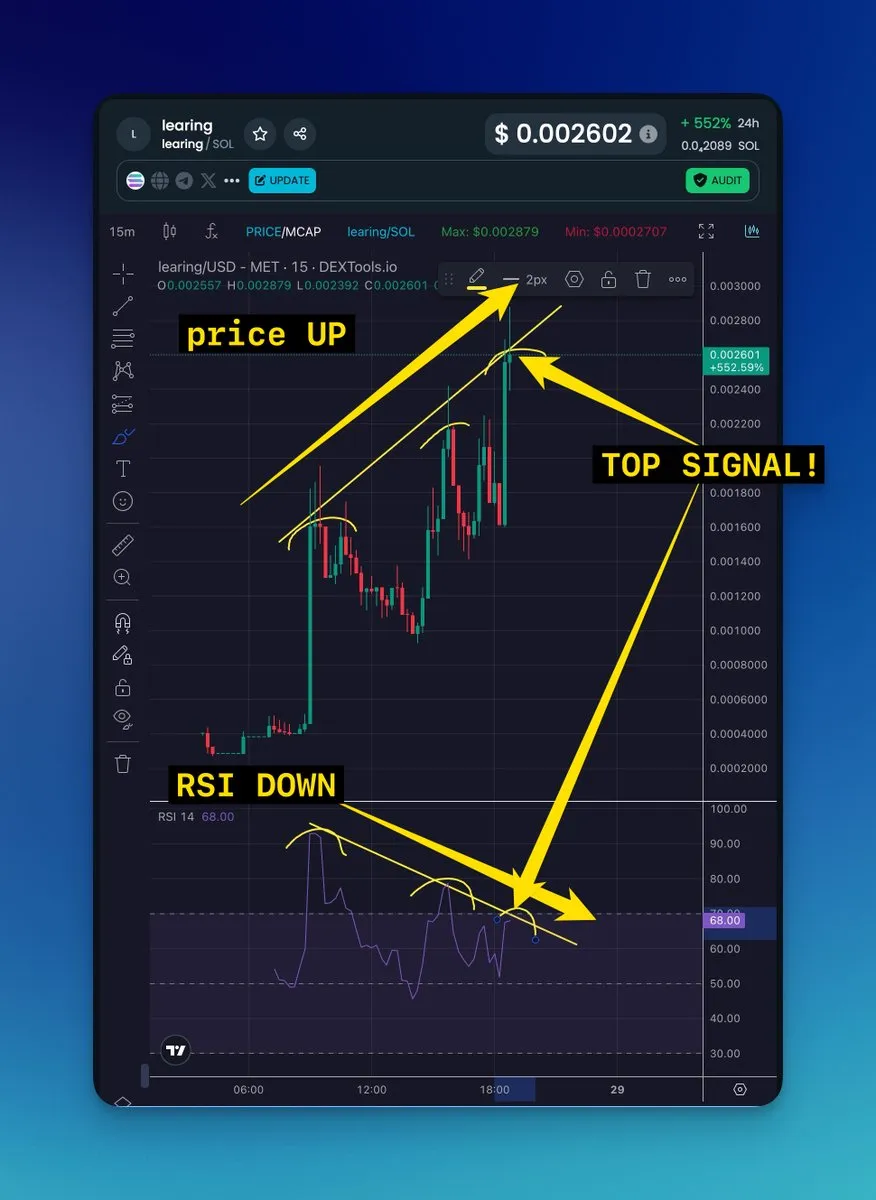
The RSI helps me tell when a move is getting tired. If the price is going up but the RSI is going down (Bearish Divergence), I know that a dump is likely to happen. I might wait for the correction to set up my entry instead of opening a wide range. On the other hand, Bullish Divergence at a support level is the best time to wait for a bounce.
5. Patterns on charts
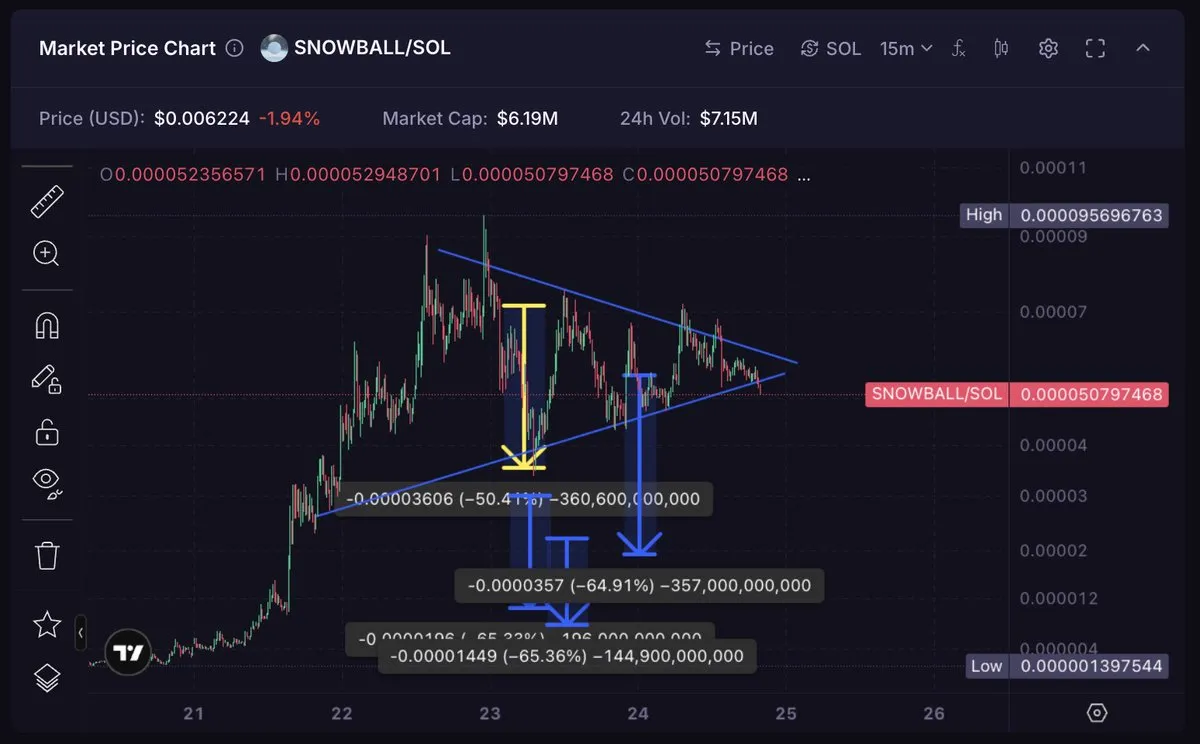
I'm looking for shapes that I know, like flags, triangles, or simple channels. If a token is trading in a nice channel, I can put my bins at the bottom of that channel and not worry about anything. It is also a signal for a move up or down.
More examples on this topic below and in the upcoming posts.
Lessons learned from the coaching sessions
I always tell my mentees this during our 1-on-1 sessions: Take a screenshot of your entry and your exit.
Why? You need to check to see if your TA was wrong or if it was just a strange market move when you look back at a position that went into heavy IL. Most of the time, the chart showed what would happen before it happened. You just didn't listen.
I've seen experienced traders lose money in LP because they don't change their range based on how volatile the token is. A token with a low market cap moves quickly. That needs to be taken into account by your TA. If you're at support but it's "weak," the price will go right through it without bouncing. In those situations, you should be ready to quickly rebalance or leave.
Michael Zogotmichaelzogot.xyz · StrategyPost
The edge is education
Education is what makes the difference between a successful LP and a "liquidity exit." To understand these levels, you have to put in the time. Use DEX Screener or GMGN to find the right chart for your pool. Every trade in that pool changes your position, so keep a close eye on the price action.
LPing is a skill. You need to practice, lose a few times, and make a lot of charts. But once you start to see the patterns, the volatility becomes your best friend instead of your worst enemy.
I'll see you in the LP ARMY Discord, @met_lparmy.
I'm a big believer that seeing is better than just reading. To make sure you actually get how to apply these concepts, I've put together a collection of my previous tweets, threads, and video breakdowns below. If you need to see this TA in action, it is right here. More about this topic coming soon.
MichaelZogot@MichaelZogotMichaelZogot@MichaelZogot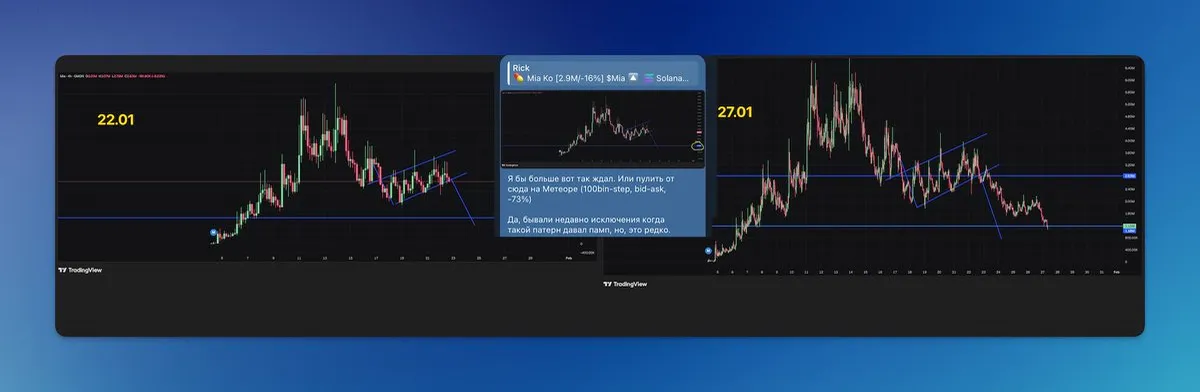 Jan 27, 2026View on X ↗MichaelZogot@MichaelZogot
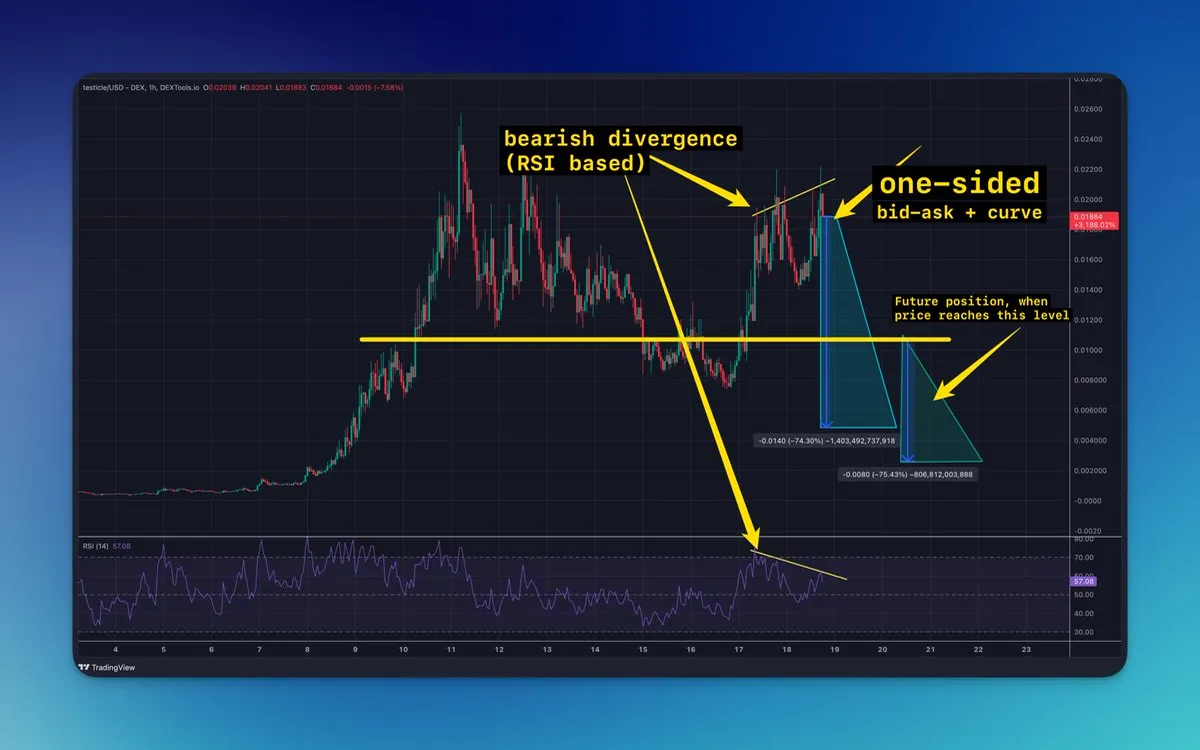 Jan 18, 2026View on X ↗MichaelZogot@MichaelZogot
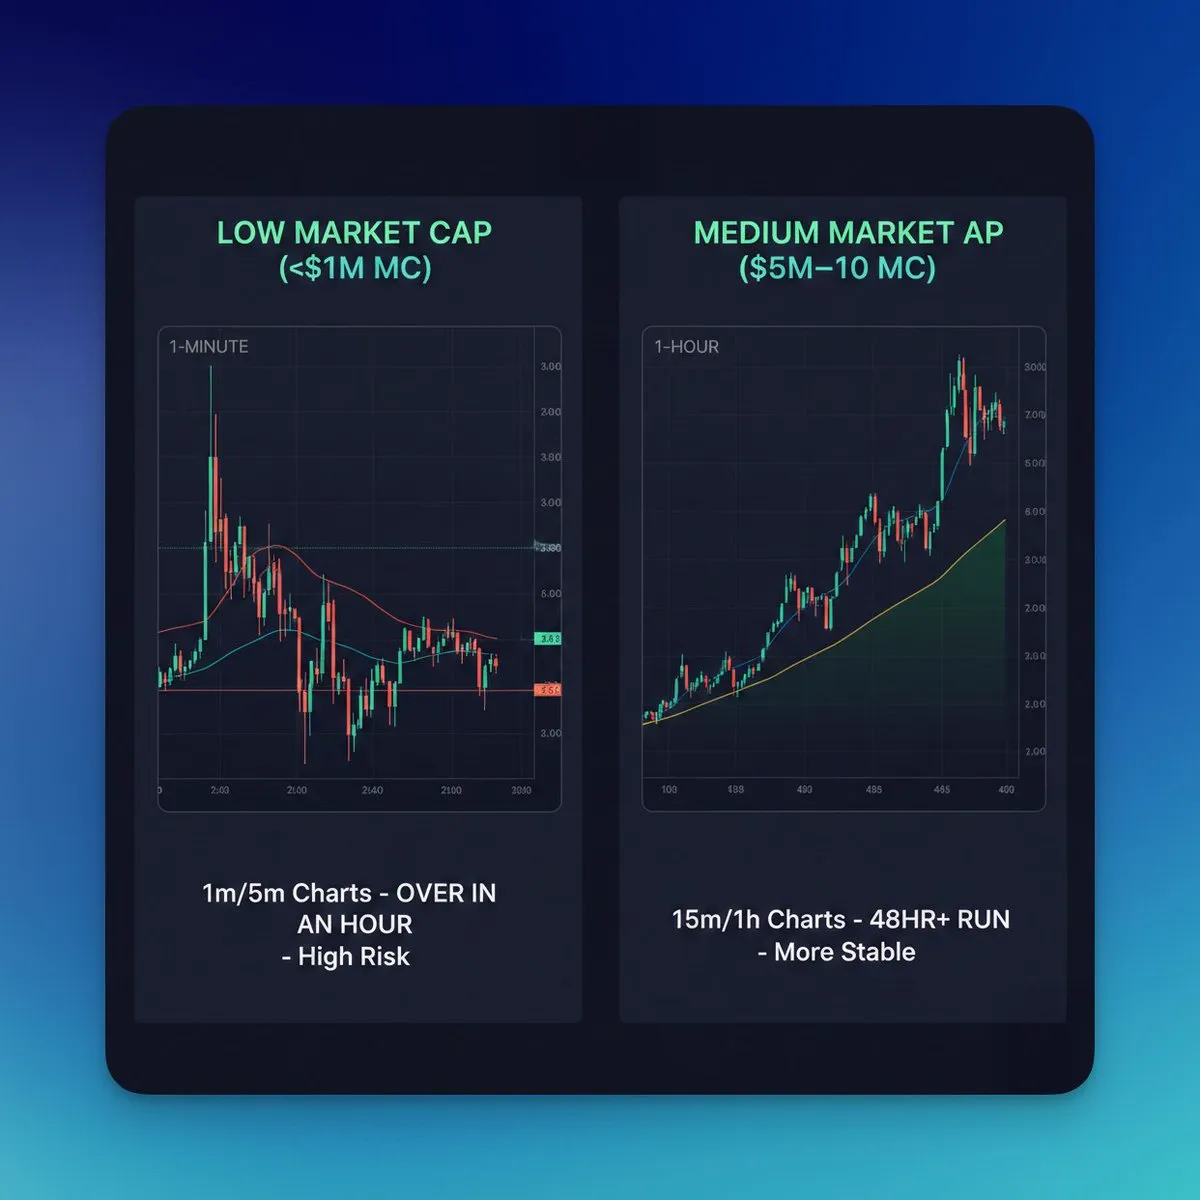 Jan 12, 2026View on X ↗Michael Zogotmichaelzogot.xyz · GuidePost
 Michael Zogotmichaelzogot.xyz · GuidePost
 MichaelZogot@MichaelZogot
 Dec 24, 2025View on X ↗MichaelZogot@MichaelZogotMichaelZogot@MichaelZogotMichaelZogot@MichaelZogotMichaelZogot@MichaelZogotMichaelZogot@MichaelZogotMichaelZogot@MichaelZogot
 Nov 28, 2025View on X ↗MichaelZogot@MichaelZogotMichaelZogot@MichaelZogot
 Aug 10, 2025View on X ↗